An animated image of the Arctic sea-ice minimum evolution between 2012 and 2023

In previous posts on the Arctic sea-ice minimum, I graphed projections of extent and volume for several individual years in order to compare it with 2012. Although this is interesting on its own, it would have been nice to see how the 2012 projection (that fatally went below zero) morphed into the s-shape that it got in recent years.

I can graph the projection of individual years and I played around with animated gifs in the past, so I thought it should be possible to make an animated image of that evolution.

Continue reading

Arctic sea-ice minimum 2023

The last Arctic sea-ice minimum dates from September last year. At that time, I was so occupied by other things that I didn’t look into the Arctic sea-ice trend back then. I now started to wonder what the Arctic sea-ice minimum did in 2023.

Let’s start with the volume data. This is how it looks like without any trendlines:

Continue reading

Not enough negative electricity prices yet?

Came across this rather confusing tweet posted a week ago by a Dutch lecturer in energy transition (translated from Dutch):

Things are not going well with negative prices yet; 13 hours so far.
But next night there will be two hours with virtually “free” electricity (ex tax): price <1 €/MWh.
In total, the Netherlands now has 31 such hours. In 2023, the Netherlands recorded 23 so far; In 2022 there were 9.
#graphoftheday

Tweet BM_Visser 2024-02-22

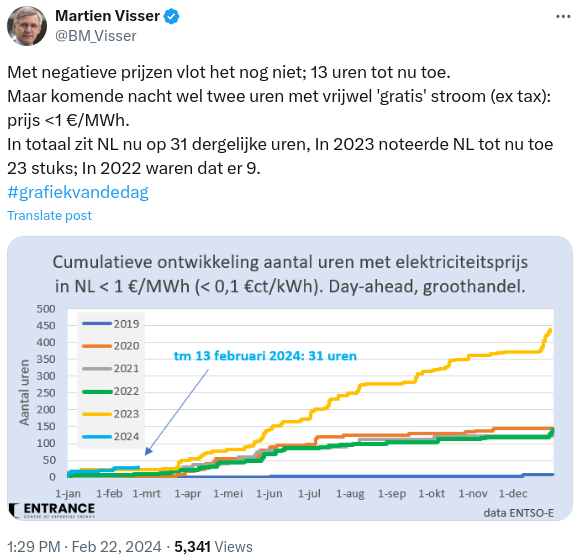
He is apparently counting the number of hours with negative prices on the Dutch grid and counted 13 hours in 2024 until then.

The graph below the tweet shows the evolution of the number of hours lower than €1/MWh from 2019 until now. It also detailed what type of price he is talking about (day-ahead prices) and that the number of hours with low (day-ahead) prices increases each year (2020 was an exception from about April on, for obvious reasons).

I was a bit confused by the fascination for those day-ahead prices. There were also cheering responses that wanted more of these negative prices. Okay, who doesn’t want (virtually) “free” electricity, but then, day-ahead prices aren’t what comes to mind when someone talks about “free” electricity (even excluding taxes).

Continue reading

Net-zero USA-48 with a storage requirement of 0.11 TWh?

In my search of the way that a 100% renewable electricity grid could function, I came across another example of how such a grid could work. Remember, in the last series of posts, I explored a first example of a spreadsheet by Georg Nitsche, but his spreadsheet failed because its strategy was entirely based on averages, therefor not representative of an actual grid. The new example that I found didn’t seem to have this flaw. As far as I initially could see, it went sequential over the data. Yet, it came to some ridiculously low storage requirements.

The example was created by Nick Stokes as a reaction to a spreadsheet by Ken Gregory showing that about 250 TWh of storage would be required in order for the USA-48 grid to function on only solar and wind. Stokes didn’t agree with the methodology and made a simple model to disprove the findings by Gregory.

Stokes disagreed because he considered the share of solar and wind in Gregory’s model too low and stated that the higher the share, the lower the storage requirement. This was also the criticism that Nitsche brought forward, that the share of solar and wind should be high enough. It was 1.56 times the demand in his spreadsheet, so an amount of about half the demand needed to be curtailed over the year.

Stokes made his calculations for multiples of the capacity of solar and wind in 2019 and calculated the following storage requirements:

Continue reading

Looking into a 100 percent Renewable Electricity Calculator for the United States: how to hide the need for seasonal storage

Previous post ended with the statement that seasonal storage is needed and this was illustrated in that post with a table of the sum of the deficits by month. This table showed that the sum of the deficits was by far the highest during the summer months, especially in July and August. However, my focus in that post was solely on those periods that had a deficit and, looking closer, this was rather one-sided. Although it is true that the periods with a deficit are the most dominant during the summer months, there are also times in July and August when there is a surplus, albeit rare and far between compared to the rest of the year. Let’s now also include the sum of the surplus in that table and see whether this will affect the conclusion of previous post.

This is the table, completed with surplus and the final balance by month:

Continue reading

Looking into a 100 percent Renewable Electricity Calculator for the United States: a severe case of averagitis

In previous post, I wondered where exactly methane storage is implemented in the 100% Renewable Electricity Calculator and how seasonal storage is dealt with. Spoiler alert, no methane storage whatsoever is implemented in the calculator and seasonal storage is not taken into account. But then, how is the proposed Power-to-Methane-to-Power backup system implemented in the spreadsheet?

The way it works is that only the totals are used in the final cost formulas and his means that problems like intermittency and seasonal storage are ironed out of existence. I can surely understand that ON AVERAGE solar and wind can keep up with demand, but this is not how a power grid works. In reality, demand in ALL time slots need to be fulfilled by solar and wind. That is where the spreadsheet is lacking.

Continue reading

Looking into a 100 percent Renewable Electricity Calculator for the United States: Power-to-Methane-to-Power

Let’s continue with the formulas in the 100% Renewable Electricity Calculator. In previous post, I looked into the first of the formulas of the backup strategies (determining the cost of the capacity of the needed backup power plants). In this post, I will look into the formula that calculates the cost of the fuel that is needed to fill in the gaps left by solar and wind. The backup strategy that was proposed in the calculator is Power-to-Gas and then back to Power.

Initially, it was not really clear what kind of Power-to-Gas was used. Different (sometimes contradictory) labels are used in the spreadsheet, mostly “Power-to-Gas”, but also “Power-to-Gas methane” and “cost hydrogen” when calculating the backup fuel cost… So, is it Power-to-Hydrogen or Power-to-Methane that is integrated in the spreadsheet? Following the link in the “source and figures” sheet, it is definitely Power-to-Methane via methanation (creation of methane from hydrogen and carbon dioxide).

I could see methane work in a grid. It is a high density fuel that can be stored for a longer period and could work in existing networks/installations. It could be a solution for seasonal storage, more than for example hydrogen could be. It will however have its drawbacks like for example high conversion losses. So, I wonder how the calculator deals with those drawbacks and how seasonal storage is implemented.

Continue reading

Looking into a 100 percent Renewable Electricity Calculator for the United States: backup capacity

In previous post, I detailed my initial struggles to figure out what is happening in the 100% renewable electricity grid calculator. It lead me try a different approach: just focus on the 8¢/kWh result and work myself backwards. That would give me a direct way to figure out the assumptions that were build in the spreadsheet.

The scenario that Nitsche proposes in the calculator is to overdimension solar and wind capacity and to convert the generated excess power into gas that can be burnt in gas-powered power plants to fill in when solar and wind electricity production is insufficient.

The formula behind the end result of 8¢/kWh is pretty straight forward. It sums the total cost over 39 years of:

  1. Solar capacity
  2. Wind capacity
  3. Battery capacity (optional, the proposed scenario doesn’t assign a battery capacity)
  4. Backup power plant capacity
  5. Production of fuel via Power-to-Gas
  6. Grid expansion

It then divides this sum by the total demand over that same period to get to the end result in cent/kWh.

In this post, I will detail how the needed capacity of those backup power plants (point 4) is calculated in the spreadsheet.

Continue reading

Looking into a 100 percent Renewable Electricity Calculator for the United States: overview

It is a long time now that I wanted to have a deeper look into the cost of systems based on intermittent power sources, but didn’t know where to begin. That is why I was very interested when I came across a cleantechnica article by Georg Nitsche who created a renewable electricity calculator in order to prove that a system based on 100% solar and wind in the US is affordable.

This first post will be a 10000-foot view of this cost model and will look into the base data that it is working with. I will go into more details of how the costs are calculated in a later post.

Continue reading

One third of electricity demand supplied by sun, wind and water (on average, that is)

Just completing a post that I started writing quite a while ago, but lay around unfinished. Central in this post is a tweet with this message (translated from Dutch):

An average of 1/3 of the total electricity demand in the Netherlands is now supplied by sun, wind and water. The record is from Sunday 24 April, with a nice 68%.
The low of last winter was on November 30, with only 4%.
#graphoftheday

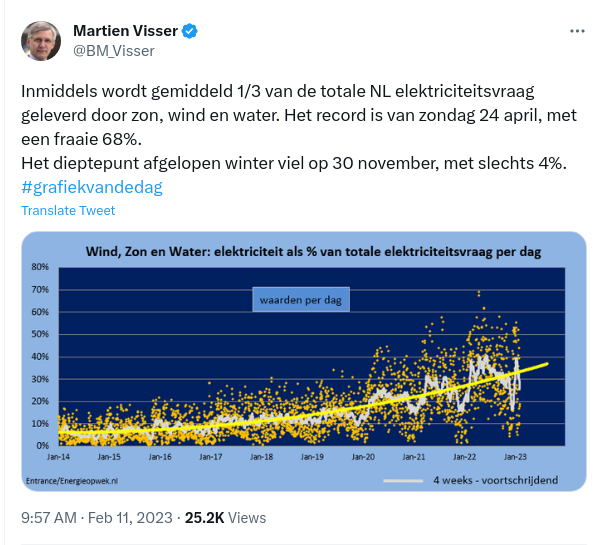
It was accompanied by a graph showing the daily energy production by solar, wind and water as percent of total demand of the Netherlands:

Tweet BM_Visser 2023-02-11

The tick yellow line is the four weeks moving average and, indeed, it ends up at roughly one third of demand at the beginning of 2023. That is however only part of the story, as also hinted by the two values that are mentioned in the text of the tweet.

Continue reading