
In the newspaper of today (Het Laatste Nieuws of December 4, 2014) I found this tiny article that caught my attention:
Now also power problems because of solar eclipse?
In the morning of March 20, 2015 in Europe a power shortage looms because of a solar eclipse. The sun, the moon and the earth are almost aligned that day, so that 84% of the sun is covered by the moon. Therefor electricity production from solar energy will drop. In Belgium solar panels representing a capacity of 3,000 MW. Which threatens to collapse largely between 09:30 AM and 11:30 AM. Professor Ronnie Belmans KU Leuven considers the probability of sudden power shortages on that day high.
Seems very dramatic, 3,000 MW is a rather large chunk of the energy that is put on the grid. But as much in alternative energy communication this is only part of the story.
First, I recognize the 3,000 MW. At this moment it is actually 2,817.61 MW. That seems a lot, almost 3 large nuclear plants, but don’t get fooled: this is the total NOMINAL solar power in Belgium. As I said many times before this is NOT the actual production. It is the maximum possible output if everything is perfectly fine. This output of 2,817.61 MW will never be reached for several reasons. For example the fact that the sun is not always available (not at night, a little bit in the morning/evening, most of it around noon). But there are other factors in play, such as the angle and position at which the solar panels are placed (which could be optimal or less optimal), drop shadows, dirt collecting on the panels,…
Second, when I look at the energy produced by the different units, then I see numbers for Liquid fuel, Wind, Nuclear, Water, Coal, Natural gas and Other. The missing part is solar power which is in the “Other” part, for the reason of its tiny share. So let’s look at how much solar power there was in the last week:
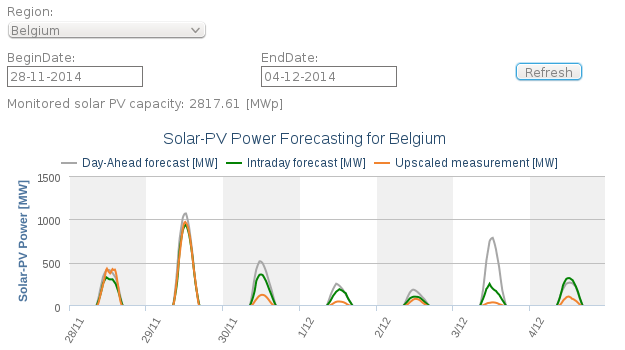
Solar output Belgium from 28/11/2014 until 20141204
It is rather clear that the output is much less than the current nominal capacity of 2,817,61 MW assumingly available. That there is much less than the nominal capacity is for the above reasons. Also very obvious is that the peaks are very variable. Some are very small, others almost five times higher. And remember, the nominal power in the graph above is twice as high as the top of the graph (the highest point in the graph is 1,500 MW while nominal power is 2,800 MW).
But this is of course not really a good comparison. The days are longer in March than in December. The difference is about 4 hours at our latitude. So let’s look at the solar energy produced in March around the 20th March of this year and the one of last year:

Solar production vs_Nominal capacity between 17 and 23 march 2013

Solar production vs Nominal capacity between 17 and 23 march 2014
The same variation here. In that period of 09:30 to 11:30 the variation goes from 2-3% to 60-70% of the nominal capacity and not in a continuous way. If you say “Wow, 60-70% of the nominal capacity, that is not that bad”, know that this is not in a continuous way, the peaks are not for long, and it bears no relation with consumption. A very low peak could occur when electricity is needed most. Or a high peak when there is already a lot of energy or less demand.
Third, how much is that compared to the total energy put on the grid in the week of the graph above? Following is the total energy production alongside the previous two graphs of Belgian solar energy:

Solar production vs Total production of electricity in Belgium between 17 and 23 March 2013

Solar production vs Total production of electricity in Belgium between 17 and 23 March 2014
Also in that period of 09:30 to 11:30 solar production is varying a lot, going from around 1% to around 20%. This means that, even on a normal day without a solar eclipse, the grid has to be able to cope with low peaks as well of high peaks.
With solar power just a marginal part and highly variable in the energy production, I am not really sure what the journalist and the good professor are fearing. If low peaks of a tiny player in the energy production couldn’t be caught by the system, then we would have had many collapses by now.

Great post. It is nice to see graphs by time of day.
Solar is not just useless, but actual damaging to power production.
It is difficult to tell whether the daytime peaks of solar production are coincident with a midday demand peak, or are the cause of the peak in output. It could be a bit of both. That is, when the sun shines brightly, maybe a gas-fired power station is taken off-line. But for winter and spring sun, that peak can be for a short period – from 11 to 2pm. If the midday peak power demand is from 12 to 1pm there is a problem. To efficiently use the solar power, of say 2000MW, the authorities have to reduce power output of the other power stations at 11, increase power at 12, reduce it at 1, then increase it at 2pm.
They may not know within 200-500MW how much solar is being generated. I would therefore predict that most of the solar electricity will by simply run into the ground unused. Otherwise there risk being power blackouts when the sun goes in. Either that, or fossil-fueled power stations must be kept idling when the sun comes out, reducing the emissions savings.
LikeLike
The midday solar peak almost coincides with the midday demand peak, solar peak comes a bit later than midday peak. I don’t think that the solar peak drives the total output peak. I have been playing with the Elia data before and at first sight the output curve over a week seems similar, whether solar output is high or not. Solar and wind seem to get priority, filled in with gas power, aided at peaks by the pumped storage installation of Coo.
Indeed, if solar (and wind) power is to be used efficiently, this means some conventional power plant(s) need to cycle down or off. When cycling down there are still emissions, when cycling on/off is not that flexible. How that is being done exactly is still a mystery to me, knowing that the Belgian power plants are old and therefor not as flexible as modern GTCC turbines. That we come into problems a couple times a year with an overproduction when demand is low (holidays) and production of wind/solar is high, shows that the process is not that flexible. My guess is that if one calculates all emissions (including that need for backup, conveniently “forgotten” to take into account by most supporters), then there will not be much emission reduction in the end.
LikeLike