Are solar and wind the cheapest? That seems to be the suggestion in this this tweet (translation from Dutch, my emphasis):
Time and time again, it appears that electricity prices decrease the more sun & wind there is in the mix.
Likewise, all trend lines will reach ZERO once the share of solar & wind approaches 100%.
January 2023 is no exception.
#graphoftheday

Ah, that elusive electricity-prices-go-down-when-the-share-of-solar-and-wind-increases narrative again. As expected, there were several commenters singing the praise of the cheapness of solar and wind energy. But then, what does he mean by “reach zero once the share of solar and wind approaches 100%”? And what exactly are those “electricity prices” that he is talking about?
Let’s first look at that monstrosity of a graph in more detail:
The graph shows the relationship between the daily day-ahead electricity prices in the Netherlands (in €/MWh) and the daily share of solar & wind in the electricity mix (in percent). Day-ahead electricity prices are the result of the trading of electricity the day before the actual production. Those prices are established at noon for all hours of the following day on for example the EPEX Spot power exchange, where power producers bid certain amounts of power for a certain price and buyers determine how much they are willing to buy at a given price. It is a whole-sale price, not the price that households pay for their electricity.
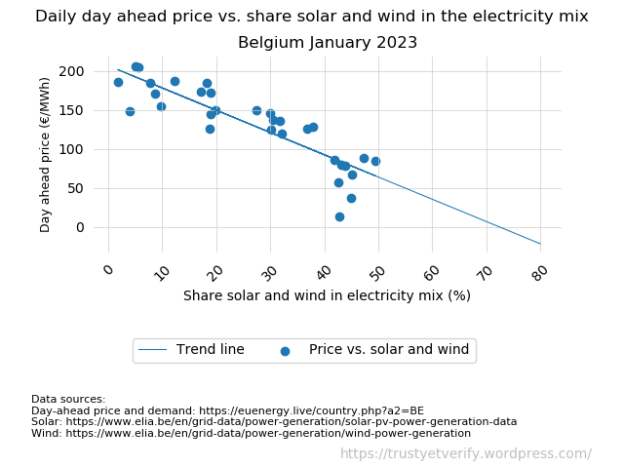
I can certainly agree that this day-ahead price is going down the larger the share of solar and wind becomes. That is know for a very long time already. Germany experienced this when implementing its energiewende, so it is not something unique to the Netherlands. Recreating this graph with the Belgian data for the same period (January 2023) gives roughly the same trend:

When extrapolating the linear trend, it is clear that the January price trend will hit the x-axis somewhere between 70 and 80%. That is also the point where the January 2023 trend seems to be heading to in the graph of the tweet.
Not all trends will end up reaching zero between 70 and 80% though. In the graph of the Netherlands, the black line (quarter 1 of 2021) and the yellowish-orange line (quarter 4 of 2020) for example are more shallow and likely hit the x-axis somewhat later. The general direction though is down and towards 100% share. That is likely what the tweeter meant by “prices reach zero once the share of solar and wind approaches 100%”.
This lowering day-ahead price is no doubt related to how much solar and wind there is available on the market, but whether that is praiseworthy is a different question. Low day-ahead prices occur when a stress situation is forecast on the grid. When there is forecast of a lot of production by inflexible power sources (like solar and wind) combined with a low demand (like at night, during weekends and holidays,…), then this will lead to an overproduction and power producers will have to bid at a lower, sometimes even at a negative, price. The higher the share of solar and wind in the electricity mix, the bigger impact it will have.
However, that the prices are lowering on the day-ahead market doesn’t mean that the cost of solar and wind energy is going down. This day-ahead price is the price that the producers will get for their power and therefor has nothing to do with the cost of their production.
It also doesn’t mean that the consumers will pay less for the energy that they use. The household consumer pricing is less volatile, they mostly pay a fixed price over a longer period, let say months or a year or so. This is what the Belgian household electricity prices did in relation to the Belgian share of solar and wind over the previous years:

There is clearly only one way the price trend for consumers is going and that is up, despite those “decreasing electricity prices” because of more sun and wind in the electricity mix.


In Sweden, wind and solar are the cheapest sources, but only due to governmental handouts. Without it, those would have been the most expensive ones. At the same time, nuclear power is expensive due to ‘special’ [woke] taxes, but would have been the cheapest otherwise.
LikeLiked by 1 person
Same here. Nuclear energy is the cheapest, solar and wind the most subsidized. The bright plan is to replace the nuclear plants with (a lesser capacity of) gas-fired power plants (which are going to need subsidies too) and hydrogen (expensive). Also, slowly but surely, the realization starts to sink in that our grid will have to be strengthened in order to cope with the increasing intermittency. I guess the realization will soon come that frequency control is a thing. So, I don’t expect the cost of electricity production to go down any time soon, on the contrary.
LikeLike
Here, the “government” try to keep the people “happy” by “generously” handing out “electrical tax returns”, funded by the money they are stealing from us … The second time, a week ago. In my case at a rate of 0.50 SEK/kWh (less than 5¢.). In January, I had to pay 5.25 SEK/kWh, the highest rate so far, so it’s a joke … 3.85 SEK/kWh in February and 2.47 SEK/kWh this month. I suppose many in the West had a tough January due to Christmas costs, so I wonder if the high rates was intentional. I have noticed that there are many ideas in progress, in how to drain money from the people, as a foreplay to Agenda 2030 – “People will own nothing and be happy” (Self proclaimed Führer ‘St.’ Klaus Schwab) …
LikeLike